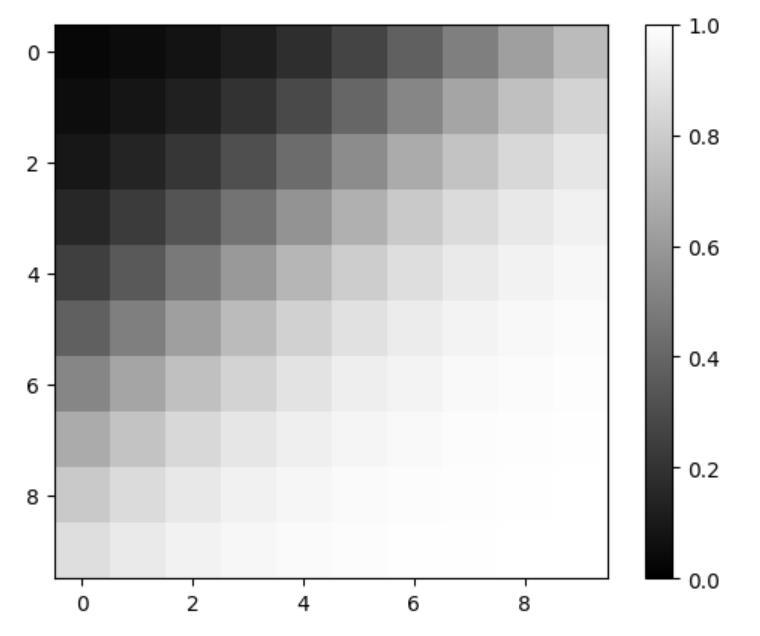
%matplotlib inline

import numpy as np
import matplotlib.pyplot as plt

# x、y坐标
X = np.arange(-1.0, 1.0, 0.2)  # 元素数量是10个
Y = np.arange(-1.0, 1.0, 0.2)

# 容纳输出的10x10的网格 用0填充
Z = np.zeros((10,10))

# x、y坐标的输入的权重
w_x = 2.5
w_y = 3.0

# 偏置
bias = -0.1

# 使用网格的各个方块对神经元进行计算
for i in range(10):
    for j in range(10):

        #  输入与权重的乘积的总和 + 偏置
        u = X[i]*w_x + Y[j]*w_y + bias

        # 将输出纳入到网格中
        y = 1/(1+np.exp(-u)) # sigmoid函数
        Z[j][i] = y

# 网格的表示
plt.imshow(Z, "gray", vmin = 0.0, vmax = 1.0)
plt.colorbar()
plt.show()

