import cv2
import matplotlib.pyplot as plt
# 画图文字使用黑体字显示(显示中文,默认不支持中文)
plt.rcParams['font.sans-serif'] = ['SimHei']
img = cv2.imread('pic/st.png')
img_gray = cv2.cvtColor(img, cv2.COLOR_RGB2GRAY)
# 采用二值化方式处理图像,像素值在182-255之间为1,小于182像素值的数据为0
ret, img_thresh = cv2.threshold(img_gray, 182, 255, 0)
# 使用简易方式,获取全部轮廓
contours, hierarchy = cv2.findContours(img_thresh, cv2.RETR_TREE, cv2.CHAIN_APPROX_SIMPLE)
# 传入的参数,图像,轮廓坐标,所有轮廓,轮廓颜色(红色),线宽
img_contour = cv2.drawContours(img.copy(), contours, -1, (0, 0, 255), 2)
img = cv2.cvtColor(img, cv2.COLOR_BGR2RGB)
img_gray = cv2.cvtColor(img_gray, cv2.COLOR_BGR2RGB)
img_thresh = cv2.cvtColor(img_thresh, cv2.COLOR_BGR2RGB)
img_contour = cv2.cvtColor(img_contour, cv2.COLOR_BGR2RGB)
# nrows, ncols, index 都是 小于 10
# 表示在当前画布的右上角创建一个1行4列的绘图区域,同时 选择在第 1 个位置绘制子图。
plt.subplot(1, 4, 1)
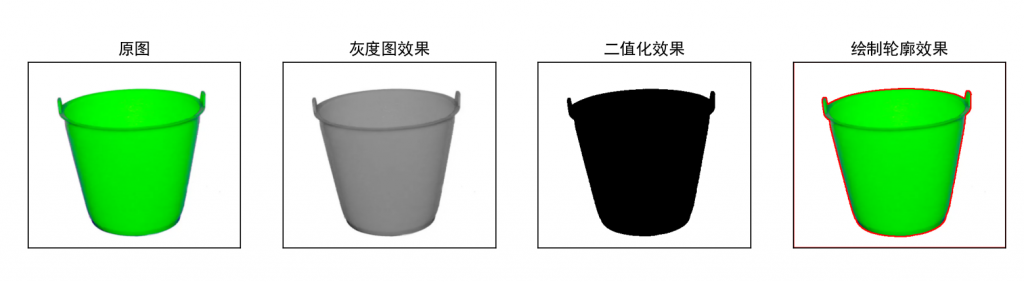
plt.title('原图')
plt.imshow(img)
# 去除图片的坐标尺
plt.xticks([])
plt.yticks([])
plt.subplot(1, 4, 2)
plt.title('灰度图效果')
plt.imshow(img_gray)
# 去除图片的坐标尺
plt.xticks([])
plt.yticks([])
plt.subplot(1, 4, 3)
plt.title('二值化效果')
plt.imshow(img_thresh)
plt.xticks([])
plt.yticks([])
plt.subplot(1, 4, 4)
plt.title('绘制轮廓效果')
plt.imshow(img_contour)
plt.xticks([])
plt.yticks([])
# 显示图像效果
plt.show()
