
x:浮点型数组,柱形图的 x 轴数据。
height:浮点型数组,柱形图的高度。
width:浮点型数组,柱形图的宽度。
bottom:浮点型数组,底座的 y 坐标,默认 0。
align:柱形图与 x 坐标的对齐方式,’center’ 以 x 位置为中心,这是默认值。 ‘edge’:将柱形图的左边缘与 x 位置对齐。要对齐右边缘的条形,可以传递负数的宽度值及 align=’edge’。
**kwargs:其他参数。
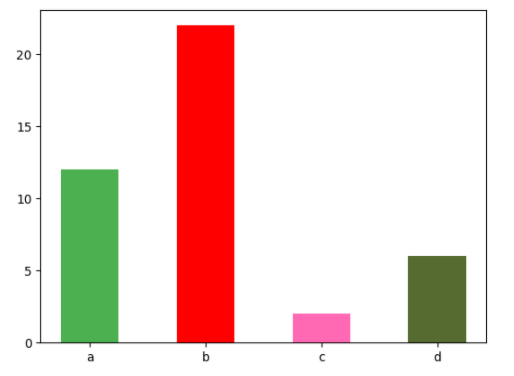
import matplotlib.pyplot as plt
import numpy as np

x = np.array(["a", "b", "c", "d"])
y = np.array([12, 22, 2, 6])

plt.bar(x, y, color = ["#4CAF50","red","hotpink","#556B2F"], width = 0.5)
plt.show()