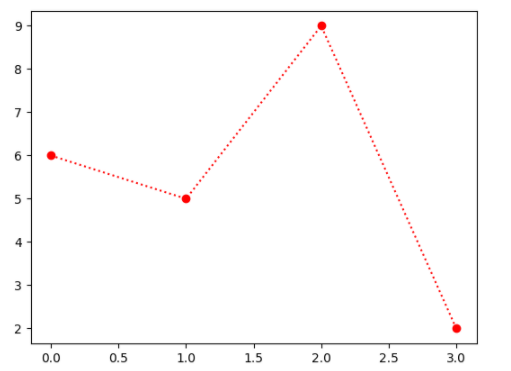
import matplotlib.pyplot as plt
import numpy as np

ypoints = np.array([1,3,4,5,8,9,10])

plt.plot(ypoints, marker = 'o')
plt.show()
“o” 实心圆
“.” 点
“^” 上三角
fmt 参数
fmt 参数定义了基本格式,如标记、线条样式和颜色。
fmt = '[marker][line][color]'
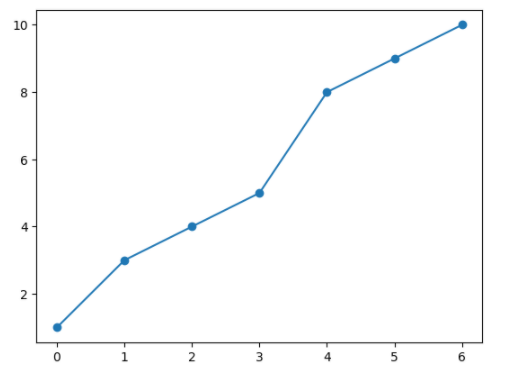
例如 o:r,o 表示实心圆标记,: 表示虚线,r 表示颜色为红色。
线类型:
| 线类型标记 | 描述 | |
|---|---|---|
| ‘-‘ | 实线 | |
| ‘:’ | 虚线 | |
| ‘–‘ | 破折线 | |
| ‘-.’ | 点划线 | |
颜色类型:
| 颜色标记 | 描述 | |
|---|---|---|
| ‘r’ | 红色 | |
| ‘g’ | 绿色 | |
| ‘b’ | 蓝色 | |
| ‘c’ | 青色 | |
| ‘m’ | 品红 | |
| ‘y’ | 黄色 | |
| ‘k’ | 黑色 | |
| ‘w’ | 白色 | |
import matplotlib.pyplot as plt
import numpy as np

ypoints = np.array([3, 5, 9, 2])

plt.plot(ypoints, 'o:r')
plt.show()