
一、Sigmoid ReLU Tanh 定义
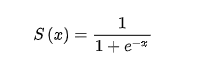
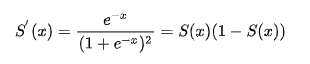
1、Sigmoid。Sigmoid函数也叫Logistic函数,用于隐层神经元输出,取值范围为(0,1),它可以将一个实数映射到(0,1)的区间,可以用来做二分类。
import torch
import matplotlib
import matplotlib.pyplot as plt
import math
plt.figure(figsize=(15,8))
# 指定默认字体
matplotlib.rcParams['font.sans-serif'] = ['SimHei']
matplotlib.rcParams['font.family']='sans-serif'
# 解决负号'-'显示为方块的问题
matplotlib.rcParams['axes.unicode_minus'] = False
ax = plt.gca() # get current axis 获得坐标轴对象
ax.spines['right'].set_color('none')
ax.spines['top'].set_color('none') # 将右边上边的两条边颜色设置为空 其实就相当于抹掉这两条边
ax.xaxis.set_ticks_position('bottom')
ax.yaxis.set_ticks_position('left') # 指定下边的边作为 x 轴 指定左边的边为 y 轴
ax.spines['bottom'].set_position(('data', 0)) # 指定data 设置的bottom(也就是指定的x轴)绑定到y轴的0这个点上
ax.spines['left'].set_position(('data', 0))
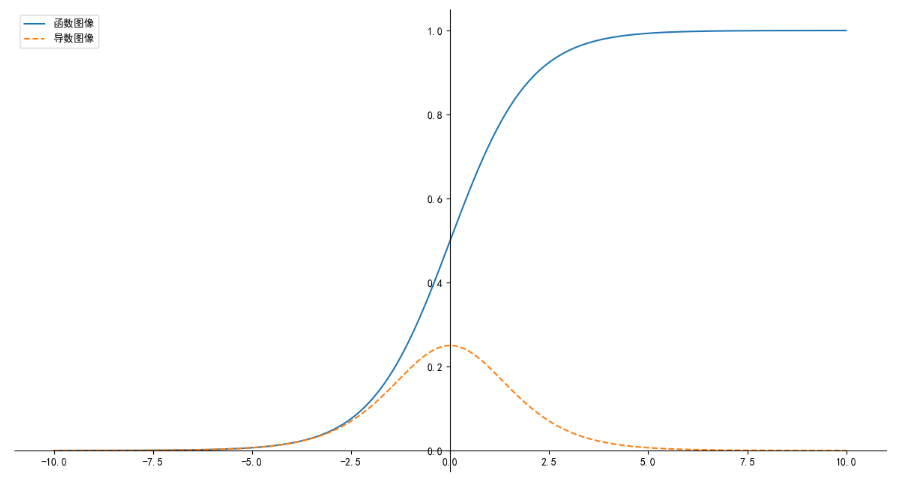
x = torch.linspace(-10, 10, 1000)
xx = 1/(1 + math.e**(-x))
# 函数图像
# Plot 返回一个 Line2D 对象列表,例如:line1, line2 = plot(x1, y1, x2, y2)。
# 在下面的代码中,假设只有一行,所以返回的列表长度为 1。使用元组拆分行,以获得该列表的第一个元素.
# line, =plt.plot(x, y, '-')
line1, = plt.plot(x.numpy(),xx.numpy())
#print(line1)
# 导数图像
line2, = plt.plot(x.numpy(),(xx*(1-xx)).numpy(),"--")
plt.legend(handles=[line1, line2],labels = ["函数图像","导数图像"])
plt.show()
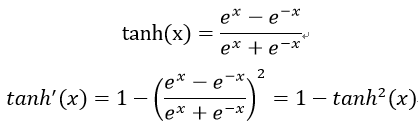
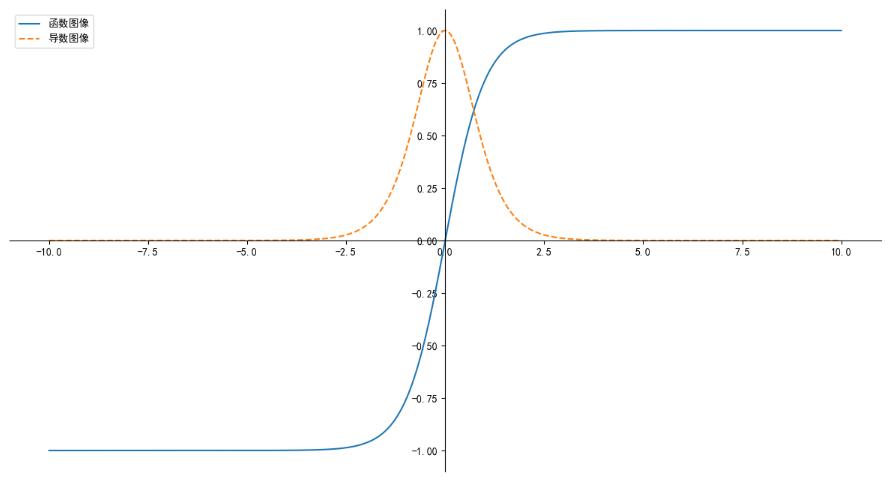
2、Tanh。
import torch
import matplotlib
import matplotlib.pyplot as plt
import math

plt.figure(figsize=(15,8))
# 指定默认字体
matplotlib.rcParams['font.sans-serif'] = ['SimHei']
matplotlib.rcParams['font.family']='sans-serif'
# 解决负号'-'显示为方块的问题
matplotlib.rcParams['axes.unicode_minus'] = False

ax = plt.gca() # get current axis 获得坐标轴对象
ax.spines['right'].set_color('none')
ax.spines['top'].set_color('none') # 将右边上边的两条边颜色设置为空 其实就相当于抹掉这两条边
ax.xaxis.set_ticks_position('bottom')
ax.yaxis.set_ticks_position('left') # 指定下边的边作为 x 轴 指定左边的边为 y 轴
ax.spines['bottom'].set_position(('data', 0)) #指定data 设置的bottom(也就是指定的x轴)绑定到y轴的0这个点上
ax.spines['left'].set_position(('data', 0))

x = torch.linspace(-10, 10, 1000)
xx = (math.e**x-math.e**-x)/(math.e**x+math.e**(-x))
# 函数图像
line1, = plt.plot(x.numpy(),xx.numpy())
# 导数图像
line2, = plt.plot(x.numpy(),(1-xx**2).numpy(),"--")
plt.legend(handles=[line1, line2],labels = ["函数图像","导数图像"])
plt.show()
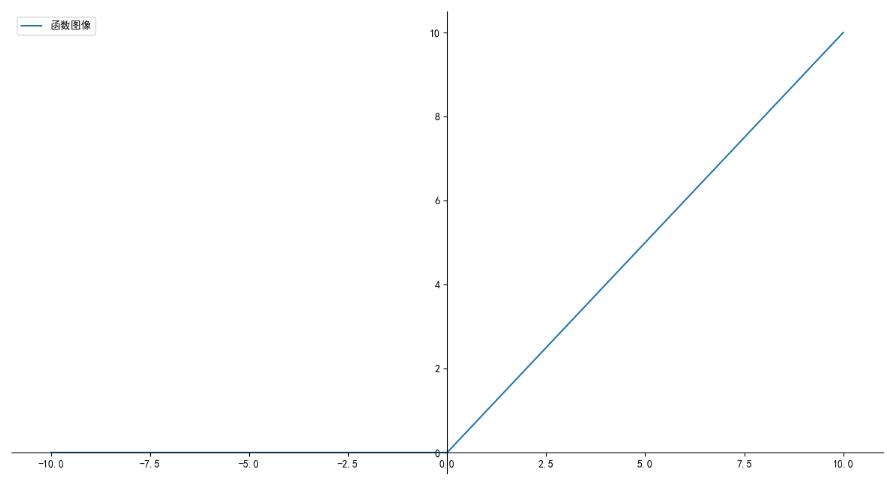
3、ReLU。
![]()
import torch
import matplotlib
import matplotlib.pyplot as plt
import math

plt.figure(figsize=(15,8))

# 指定默认字体
matplotlib.rcParams['font.sans-serif'] = ['SimHei']
matplotlib.rcParams['font.family']='sans-serif'
# 解决负号'-'显示为方块的问题
matplotlib.rcParams['axes.unicode_minus'] = False
ax = plt.gca() # get current axis 获得坐标轴对象
ax.spines['right'].set_color('none')
ax.spines['top'].set_color('none') # 将右边上边的两条边颜色设置为空 其实就相当于抹掉这两条边
ax.xaxis.set_ticks_position('bottom')
ax.yaxis.set_ticks_position('left') # 指定下边的边作为 x 轴 指定左边的边为 y 轴
ax.spines['bottom'].set_position(('data', 0)) # 指定data 设置的bottom(也就是指定的x轴)绑定到y轴的0这个点上
ax.spines['left'].set_position(('data', 0))
x = torch.linspace(-10,10,5000)
xx = torch.max(torch.Tensor([0]),x)

# 函数图像
line1, = plt.plot(x.numpy(),xx.numpy())
plt.legend(handles=[line1,],labels = ["函数图像"])
plt.show()
二、Pytorch 内置 sigmoid、relu、tanh的应用
1、sigmoid。
import torch

a = torch.Tensor([-1,0,1])
print(a)
print(torch.sigmoid(a))
print(a.sigmoid())
tensor([-1.,  0.,  1.])
tensor([0.2689, 0.5000, 0.7311])
tensor([0.2689, 0.5000, 0.7311])
2、relu。
import torch
a = torch.Tensor([-1,0,1])
print(a)
print(torch.relu(a))
print(a.relu())
tensor([-1.,  0.,  1.])
tensor([0., 0., 1.])
tensor([0., 0., 1.])
3、tanh。
import torch

a = torch.Tensor([-1,0,1])
print(a)
print(torch.tanh(a))
print(a.tanh())
tensor([-1.,  0.,  1.])
tensor([0.2689, 0.5000, 0.7311])
tensor([0.2689, 0.5000, 0.7311])