
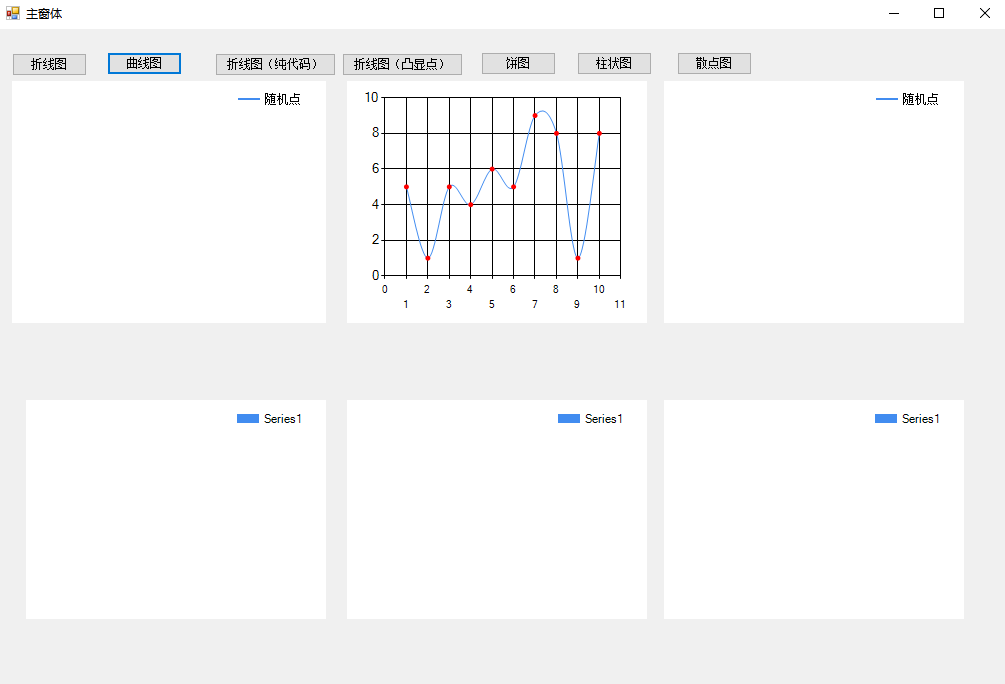
SeriesChartType.Line 折线 SeriesChartType.Spline 曲线
using System;
using System.Collections.Generic;
using System.ComponentModel;
using System.Data;
using System.Drawing;
using System.Linq;
using System.Text;
using System.Threading.Tasks;
using System.Windows.Forms;
using System.Windows.Forms.DataVisualization.Charting;

namespace WindowsApp
{
    public partial class FormMain : Form
    {
        public FormMain()
        {
            InitializeComponent();
        }

        /// <summary>
        /// 折线图
        /// </summary>
        /// <param name="sender"></param>
        /// <param name="e"></param>
        private void btnLine_Click(object sender, EventArgs e)
        {
            // 列表
            List<int> ListPoint = new List<int>();
            Random random = new Random();

            int num = 0;
            for (int i = 0; i < 10; i++)
            {
                num = random.Next(0, 10); // 随机数
                ListPoint.Add(num);
            }

            // 清除所有 节点
            chartLine.Series[0].Points.Clear();

            for (int i = 0; i < ListPoint.Count; i++)
            {
                // 增加 节点
                chartLine.Series[0].Points.AddXY(i + 1, ListPoint[i]);
            }
        }

        /// <summary>
        /// 折线图/饼图
        /// </summary>
        /// <param name="sender"></param>
        /// <param name="e"></param>
        private void btnPie_Click(object sender, EventArgs e)
        {
            string[] x = new string[] { "1月", "2月", "3月", "4月", "5月" };
            double[] y = new double[] { 500, 900, 700, 650, 450 };

            // 标题
            chartView.Titles.Add("折线范例");
            chartView.Titles[0].ForeColor = Color.Blue;
            chartView.Titles[0].Font = new Font("微软雅黑", 12f, FontStyle.Regular);
            chartView.Titles[0].Alignment = ContentAlignment.TopCenter;
            chartView.Titles.Add("右标题");
            chartView.Titles[1].ForeColor = Color.Blue;
            chartView.Titles[1].Font = new Font("微软雅黑", 8f, FontStyle.Regular);
            chartView.Titles[1].Alignment = ContentAlignment.TopRight;

            // 控件背景
            chartView.BackColor = Color.Transparent;
            // 图表区背景
            chartView.ChartAreas[0].BackColor = Color.Transparent;
            chartView.ChartAreas[0].BorderColor = Color.Transparent;
            // X轴标签间距
            chartView.ChartAreas[0].AxisX.Interval = 1;
            chartView.ChartAreas[0].AxisX.LabelStyle.IsStaggered = true;
            chartView.ChartAreas[0].AxisX.LabelStyle.Angle = -30;
            chartView.ChartAreas[0].AxisX.TitleFont = new Font("微软雅黑", 14f, FontStyle.Regular);
            chartView.ChartAreas[0].AxisX.TitleForeColor = Color.Black;

            // X坐标轴颜色
            //chartView.ChartAreas[0].AxisX.LineColor = ColorTranslator.FromHtml("#808080");
            chartView.ChartAreas[0].AxisX.LabelStyle.ForeColor = Color.Black;
            chartView.ChartAreas[0].AxisX.LabelStyle.Font = new Font("微软雅黑", 10f, FontStyle.Regular);
            // X坐标轴标题
            chartView.ChartAreas[0].AxisX.Title = "月份";
            chartView.ChartAreas[0].AxisX.TitleFont = new Font("微软雅黑", 10f, FontStyle.Regular);
            chartView.ChartAreas[0].AxisX.TitleForeColor = Color.Black;
            chartView.ChartAreas[0].AxisX.TextOrientation = TextOrientation.Horizontal;
            // X轴网络线条
            chartView.ChartAreas[0].AxisX.MajorGrid.Enabled = true;
            //chartView.ChartAreas[0].AxisX.MajorGrid.LineColor = ColorTranslator.FromHtml("#E6E6FA");

            // Y坐标轴颜色
            //chartView.ChartAreas[0].AxisY.LineColor = ColorTranslator.FromHtml("#808080");
            chartView.ChartAreas[0].AxisY.LabelStyle.ForeColor = Color.Black;
            chartView.ChartAreas[0].AxisY.LabelStyle.Font = new Font("微软雅黑", 10f, FontStyle.Regular);
            // Y坐标轴标题
            chartView.ChartAreas[0].AxisY.Title = "数量(台)";
            chartView.ChartAreas[0].AxisY.TitleFont = new Font("微软雅黑", 10f, FontStyle.Regular);
            chartView.ChartAreas[0].AxisY.TitleForeColor = Color.Black;
            chartView.ChartAreas[0].AxisY.TextOrientation = TextOrientation.Rotated270;
            chartView.ChartAreas[0].AxisY.ToolTip = "数量(台)";
            // Y轴网格线条
            chartView.ChartAreas[0].AxisY.MajorGrid.Enabled = true;
            //chartView.ChartAreas[0].AxisY.MajorGrid.LineColor = ColorTranslator.FromHtml("#E6E6FA");

            //chartView.ChartAreas[0].AxisY2.LineColor = Color.Transparent;

            // 背景渐变
            chartView.ChartAreas[0].BackGradientStyle = GradientStyle.None;

            // 图例样式
            Legend legend = new Legend("销量");
            legend.Title = "图例";
            legend.TitleBackColor = Color.Transparent;
            legend.BackColor = Color.Transparent;
            legend.TitleForeColor = Color.Black;
            legend.TitleFont = new Font("微软雅黑", 10f, FontStyle.Regular);
            legend.Font = new Font("微软雅黑", 8f, FontStyle.Regular);
            legend.ForeColor = Color.Black;

            chartView.Series[0].XValueType = ChartValueType.String; // 设置X轴上的值类型
            chartView.Series[0].Label = "#VAL"; // 设置显示X Y的值
            chartView.Series[0].LabelForeColor = Color.Blue;
            chartView.Series[0].ToolTip = "#VALX:#VAL(台)"; // 鼠标移动到对应点显示数值
            chartView.Series[0].ChartType = SeriesChartType.Line; // 图类型 折线Line 饼图 Pie

            chartView.Series[0].Color = Color.SkyBlue;
            chartView.Series[0].LegendText = legend.Name;
            chartView.Series[0].IsValueShownAsLabel = true;
            chartView.Series[0].LabelForeColor = Color.Black;
            chartView.Series[0].CustomProperties = "DrawingStyle = Cylinder";
            chartView.Series[0].CustomProperties = "PieLabelStyle = Outside";
            chartView.Legends.Add(legend);
            chartView.Legends[0].Position.Auto = true;
            chartView.Series[0].IsValueShownAsLabel = true;
            // 是否显示图例
            chartView.Series[0].IsVisibleInLegend = true;
            chartView.Series[0].ShadowOffset = 0;

            // 折线
            //chartView.Series[0]["PieLineColor"] = "Blue";
            // 绑定数据
            chartView.Series[0].Points.DataBindXY(x, y);
            chartView.Series[0].Points[0].Color = Color.Black;
            // 绑定颜色
            //chartView.Series[0].Palette = ChartColorPalette.BrightPastel;

        }

        /// <summary>
        /// 折线图凸显点
        /// </summary>
        /// <param name="sender"></param>
        /// <param name="e"></param>
        private void btnLinePoint_Click(object sender, EventArgs e)
        {
            // 清除所有 节点
            chartLine.Series[0].Points.Clear();

            List<string> x = new List<string>() { "A", "B", "C", "D", "E", "F", "G" };
            List<int> y = new List<int>() { 10, 20, 30, 40, 35, 25, 15 };
            // 线条颜色
            chartLine.Series[0].Color = Color.Blue;
            // 线条粗细
            chartLine.Series[0].BorderWidth = 3;
            // 标记点边框颜色
            chartLine.Series[0].MarkerBorderColor = Color.Black;
            // 标记点边框大小
            chartLine.Series[0].MarkerBorderWidth = 3;
            // 标记点中心颜色
            chartLine.Series[0].MarkerColor = Color.Red;
            // 标记点大小
            chartLine.Series[0].MarkerSize = 8;
            // 标记点类型
            chartLine.Series[0].MarkerStyle = MarkerStyle.Square;
            // 将文字移到外侧
            chartLine.Series[0]["PieLabelStyle"] = "Outside";
            // 绘制黑色的连线
            chartLine.Series[0]["PieLineColor"] = "Black";
            chartLine.Series[0].Points.DataBindXY(x, y);
        }

        /// <summary>
        /// 饼图
        /// </summary>
        /// <param name="sender"></param>
        /// <param name="e"></param>
        private void btnPieOnly_Click(object sender, EventArgs e)
        {
            List<string> x = new List<string>() { "A", "B", "C", "D", "E", "F", "G" };
            List<int> y = new List<int>() { 10, 20, 30, 40, 35, 25, 15 };

            chartPie.Series[0].ChartType = SeriesChartType.Pie; // 图类型
            chartPie.Series[0]["PieLabelStyle"] = "Outside"; // 将文字移到外侧
            chartPie.Series[0]["PieLineColor"] = "Black"; // 绘制黑色的连线
            chartPie.Series[0].IsValueShownAsLabel = true;
            chartPie.Series[0].Points.DataBindXY(x, y);

        }

        /// <summary>
        /// 柱状图
        /// </summary>
        /// <param name="sender"></param>
        /// <param name="e"></param>
        private void btnBar_Click(object sender, EventArgs e)
        {
            // 清除所有 节点
            chartBar.Series.Clear();
            //chartBar.Series[0].ChartType = SeriesChartType.Bar;

            // 创建Series
            Series a = new Series();
            a.LegendText = "柱a";

            Series b = new Series();
            b.LegendText = "柱b";

            Series c = new Series();
            c.LegendText = "柱c";

            // 随机数
            Random r = new Random();
            for (int i = 1; i < 10; i++)
            {
                // 加入集合
                a.Points.AddXY(i, r.Next(1, 9));
                b.Points.AddXY(i, r.Next(10, 20));
                c.Points.AddXY(i, r.Next(21, 30));
            }

            // 指定柱形条的颜色
            a.Color = Color.Green;
            b.Color = Color.Red;
            c.Color = Color.Black;

            // 加入到chartBar中
            chartBar.Series.Add(a);
            chartBar.Series.Add(b);
            chartBar.Series.Add(c);

            // X轴网格线条
            chartBar.ChartAreas[0].AxisX.MajorGrid.Enabled = false;

            //chartBar.Series[0].LegendText = "a";
            //chartBar.Series[1].LegendText = "b";
            //chartBar.Series[2].LegendText = "c";
        }

        /// <summary>
        /// 散点图
        /// </summary>
        /// <param name="sender"></param>
        /// <param name="e"></param>
        private void btnPoint_Click(object sender, EventArgs e)
        {

            // 列表
            List<int> ListPoint = new List<int>();
            Random random = new Random();

            int num = 0;
            for (int i = 0; i < 10; i++)
            {
                num = random.Next(0, 10); // 随机数
                ListPoint.Add(num);
            }

            // 清除所有 节点
            chartPoint.Series[0].Points.Clear();

            for (int i = 0; i < ListPoint.Count; i++)
            {
                // 增加 节点
                chartPoint.Series[0].Points.AddXY(i + 1, ListPoint[i]);
            }

            // 是否显示图例
            chartPoint.Series[0].IsVisibleInLegend = false;

            chartPoint.Series[0].ChartType = SeriesChartType.Point; // 图类型

            chartPoint.Series[0].MarkerColor = Color.Red; // 标记点中心颜色
            chartPoint.Series[0].MarkerStyle = MarkerStyle.Circle; // 标记点类型
        }

        /// <summary>
        /// 曲线图
        /// </summary>
        /// <param name="sender"></param>
        /// <param name="e"></param>
        private void btnSPLine_Click(object sender, EventArgs e)
        {
            // 列表
            List<int> ListPoint = new List<int>();
            Random random = new Random();

            int num = 0;
            for (int i = 0; i < 10; i++)
            {
                num = random.Next(0, 10); // 随机数
                ListPoint.Add(num);
            }

            // 清除所有 节点
            chartSPLine.Series[0].Points.Clear();

            for (int i = 0; i < ListPoint.Count; i++)
            {
                // 增加 节点
                chartSPLine.Series[0].Points.AddXY(i + 1, ListPoint[i]);
            }

            // 是否显示图例
            chartSPLine.Series[0].IsVisibleInLegend = false;

            chartSPLine.Series[0].ChartType = SeriesChartType.Spline; // 图类型

            chartSPLine.Series[0].MarkerColor = Color.Red; // 标记点中心颜色
            chartSPLine.Series[0].MarkerStyle = MarkerStyle.Circle; // 标记点类型
        }
    }
}